How to check Elasticsearch remote cluster connections
Checking Elasticsearch remote cluster connections confirms whether a local cluster currently has an open path to a configured remote alias before cross-cluster search or cross-cluster replication depends on it. It catches endpoint, security, and optional-remote problems that can otherwise make remote data disappear from a search result or leave follower indices unable to advance.
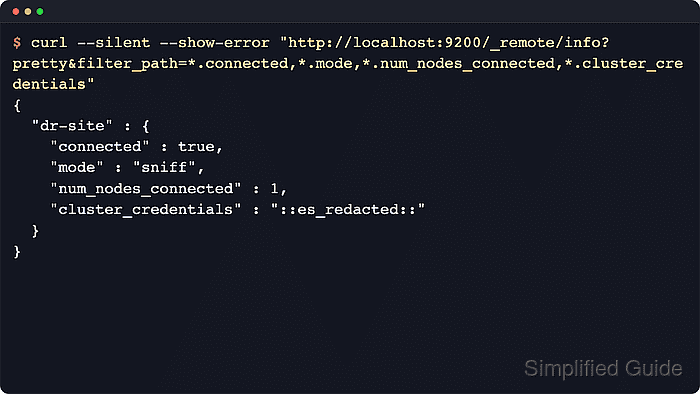
The remote cluster info API, _remote/info, reports connection state from the local cluster's view. Each alias shows its connection mode, endpoint fields, connected node or proxy socket counts, skip_unavailable behavior, and, for API-key remotes, the cluster_credentials marker.
The connected field means Elasticsearch has an open remote connection now; it does not prove that a target index exists or that the requesting user has remote_indices privileges. Use the same local endpoint, credentials, and HTTPS trust path that operators use for CCS or CCR requests, and remember that certificate-based remote-cluster security was deprecated in Elasticsearch 9.0 while API-key remotes use the dedicated remote-cluster interface on 9443 by default.
Steps to check Elasticsearch remote cluster connections:
- Query remote cluster information from a local Elasticsearch node.
$ curl --silent --show-error --user elastic:strong-password "https://local-es.example.net:9200/_remote/info?pretty"
{
  "dr-site" : {
    "connected" : true,
    "mode" : "sniff",
    "seeds" : [
      "remote-es.example.net:9443"
    ],
    "num_nodes_connected" : 1,
    "max_connections_per_cluster" : 3,
    "initial_connect_timeout" : "30s",
    "skip_unavailable" : false,
    "cluster_credentials" : "::es_redacted::"
  }
}
The request needs the cluster monitor privilege on secured clusters. The cluster_credentials marker means the remote alias is using API-key authentication; a missing marker usually means certificate-based authentication.
- Reduce the response to the connection fields when several aliases are configured.
$ curl --silent --show-error --user elastic:strong-password "https://local-es.example.net:9200/_remote/info?pretty&filter_path=*.connected,*.mode,*.skip_unavailable,*.num_nodes_connected,*.num_proxy_sockets_connected,*.seeds,*.proxy_address,*.cluster_credentials"
{
  "dr-site" : {
    "connected" : true,
    "mode" : "sniff",
    "skip_unavailable" : false,
    "num_nodes_connected" : 1,
    "seeds" : [
      "remote-es.example.net:9443"
    ],
    "cluster_credentials" : "::es_redacted::"
  }
}
Since Elasticsearch 8.15, a remote alias without an explicit skip_unavailable setting is treated as optional for cross-cluster search. Required remotes should show skip_unavailable: false.
Proxy mode reports proxy_address and num_proxy_sockets_connected instead of the sniff-mode seed and node count fields.
- Test TCP reachability to the exact remote endpoint shown for the alias.
$ nc -vz -w 3 remote-es.example.net 9443
Ncat: Version 7.92 ( https://nmap.org/ncat )
Ncat: Connected to 203.0.113.50:9443.
Ncat: 0 bytes sent, 0 bytes received in 0.02 seconds.
Use proxy_address for proxy mode or a seed host for sniff mode. API-key remotes use the remote-cluster server port 9443 by default; legacy certificate-based remotes usually use the transport port 9300.
- Trigger a fresh resolve check for the remote index pattern that should be reachable.
$ curl --silent --show-error --user elastic:strong-password "https://local-es.example.net:9200/_resolve/cluster/dr-site:logs-*?pretty&timeout=5s&filter_path=dr-site.connected,dr-site.skip_unavailable,dr-site.matching_indices,dr-site.version.number"
{
  "dr-site" : {
    "connected" : true,
    "skip_unavailable" : false,
    "matching_indices" : true,
    "version" : {
      "number" : "9.4.2"
    }
  }
}
The _resolve/cluster request can trigger a reconnect attempt when _remote/info is stale. matching_indices: false with connected: true points to an index-pattern or privilege issue rather than a remote-cluster connection failure.
- Inspect local Elasticsearch logs when an alias is disconnected or the resolve check fails.
$ sudo grep --ignore-case --extended-regexp 'remote cluster|connect_exception|failed to establish trust|closed by remote|RemoteClusterService|SniffConnectionStrategy|ProxyConnectionStrategy' /var/log/elasticsearch/elasticsearch.log
[2026-06-18T04:46:04,154][WARN ][o.e.d.t.RemoteConnectionManager] [local-es-01] The remote cluster connection to [dr-site] is using the certificate-based security model. The certificate-based security model is deprecated.
[2026-06-18T04:46:04,201][INFO ][o.e.t.RemoteClusterService] [local-es-01] remote cluster connection [dr-site] updated: CONNECTED
connect_exception usually points to host, port, routing, or firewall trouble. failed to establish trust points to a TLS CA or certificate mismatch. API-key problems commonly mention the wrong key type or an authentication failure.
Official packages write application logs under /var/log/elasticsearch by default. Use journalctl with --unit elasticsearch.service and --grep only when the service is configured to send application logs to the systemd journal.
Related: How to manage the Elasticsearch service with systemctl in Linux