How to deploy the Ceph monitoring stack with cephadm
A cephadm-managed Ceph cluster can run its monitoring services as orchestrated daemons instead of leaving Prometheus, Grafana, Alertmanager, and host exporters as separate hand-built services. Deploying the stack is useful when a cluster was bootstrapped with --skip-monitoring-stack, converted into cephadm management, or built before monitoring was ready for operators.
Ceph normally creates a basic monitoring stack during cephadm bootstrap unless the skip option is used. Adding it later uses the Ceph orchestrator, so service placement, container images, reconfiguration, and daemon status stay visible through the same ceph orch commands used for other managed services.
Use an administrator shell that can run ceph commands against an existing healthy cluster. Monitoring endpoints can expose hostnames, pool names, capacity, daemon metadata, and alert state, so keep them on a trusted management network and enable secure monitoring before exposing them outside storage operations.
Related: How to check Ceph cluster health
Related: How to enable the Ceph Dashboard
Related: How to enable Prometheus monitoring for Ceph
Steps to deploy the Ceph monitoring stack with cephadm:
- Check cluster health before adding monitoring daemons.
$ ceph -s
  cluster:
    id:     11111111-2222-3333-4444-555555555555
    health: HEALTH_OK

  services:
    mon: 3 daemons, quorum ceph-node1,ceph-node2,ceph-node3 (age 2h)
    mgr: ceph-admin.abc123(active, since 2h), standbys: ceph-node2
    osd: 6 osds: 6 up, 6 in

  data:
    pools:   4 pools, 256 pgs
    objects: 3.42M objects, 8.1 TiB
    usage:   24 TiB used, 76 TiB / 100 TiB avail
    pgs:     256 active+clean
Use sudo cephadm shell -- ceph -s when the admin keyring is not installed on the current host.
Related: How to check Ceph cluster health - List the current orchestrated services.
$ ceph orch ls
NAME   PORTS  RUNNING  REFRESHED  AGE  PLACEMENT
crash             3/3  2m ago     3h   *
mgr               2/2  2m ago     3h   count:2
mon               3/3  2m ago     3h   count:3
##### snipped #####
If alertmanager, grafana, node-exporter, and prometheus already appear with the intended RUNNING counts, skip to the verification checks instead of applying duplicate services.
- Deploy node-exporter on cluster hosts.
$ ceph orch apply node-exporter
Scheduled node-exporter update...
node-exporter exposes host CPU, memory, disk, and network metrics for Prometheus scraping.
- Deploy Alertmanager.
$ ceph orch apply alertmanager
Scheduled alertmanager update...
Alertmanager receives alert notifications from Prometheus and supports the Ceph Dashboard alerting view when the dashboard API settings point to it.
- Deploy Prometheus for the Ceph monitoring stack.
$ ceph orch apply prometheus
Scheduled prometheus update...
A single Prometheus daemon is enough for a basic stack. Use ceph orch apply prometheus --placement 'count:2' when the cluster has enough hosts and the monitoring design requires two Prometheus daemons.
- Deploy Grafana.
$ ceph orch apply grafana
Scheduled grafana update...
Current cephadm configures Grafana for the Ceph Dashboard path automatically. Use a service spec only when the deployment needs a custom network, port, protocol, certificate, or placement.
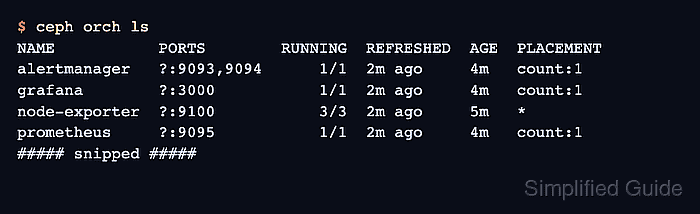
- Confirm that the monitoring service specs are present.
$ ceph orch ls
NAME           PORTS        RUNNING  REFRESHED  AGE  PLACEMENT
alertmanager   ?:9093,9094      1/1  2m ago     4m   count:1
grafana        ?:3000           1/1  2m ago     4m   count:1
node-exporter  ?:9100           3/3  2m ago     5m   *
prometheus     ?:9095           1/1  2m ago     4m   count:1
##### snipped #####
The RUNNING count must match the desired count for each service before endpoint checks are useful.
- Refresh daemon placement and container status.
$ ceph orch ps --refresh
NAME                         HOST        PORTS        STATUS         REFRESHED  AGE  VERSION
alertmanager.ceph-node1      ceph-node1  *:9093,9094  running        8s ago     4m   20.2.0
grafana.ceph-node1           ceph-node1  *:3000       running        8s ago     4m   20.2.0
node-exporter.ceph-admin     ceph-admin  *:9100       running        8s ago     5m   20.2.0
node-exporter.ceph-node1     ceph-node1  *:9100       running        8s ago     5m   20.2.0
node-exporter.ceph-node2     ceph-node2  *:9100       running        8s ago     5m   20.2.0
prometheus.ceph-node1        ceph-node1  *:9095       running        8s ago     4m   20.2.0
##### snipped #####
REFRESHED shows when cephadm last checked the daemon. Re-run the command after a short wait if a new daemon still shows starting or has stale refresh data.
- Check the manager metrics endpoint that Prometheus scrapes.
$ ceph mgr services
{
    "dashboard": "https://ceph-admin:8443/",
    "prometheus": "http://ceph-admin:9283/"
}
The prometheus entry is the ceph-mgr exporter endpoint for Ceph metrics, not the embedded Prometheus server itself.
Related: How to enable Prometheus monitoring for Ceph - Request the Ceph metrics endpoint from a host that can reach the active manager.
$ curl --silent http://ceph-admin:9283/metrics # HELP ceph_pool_metadata Pool metadata # TYPE ceph_pool_metadata untyped ceph_pool_metadata{pool_id="1",name="rbd"} 1.0 # HELP ceph_osd_metadata OSD metadata # TYPE ceph_osd_metadata gauge ceph_osd_metadata{ceph_daemon="osd.0",hostname="ceph-node1"} 1.0 ##### snipped ##### - Check the embedded Prometheus targets API.
$ curl --silent http://ceph-node1:9095/api/v1/targets
{
  "status": "success",
  "data": {
    "activeTargets": [
      {
        "scrapeUrl": "http://ceph-admin:9283/metrics",
        "health": "up",
        "labels": {
          "job": "ceph",
          "instance": "ceph-admin:9283"
        }
      },
      {
        "scrapeUrl": "http://ceph-node1:9100/metrics",
        "health": "up",
        "labels": {
          "job": "node-exporter",
          "instance": "ceph-node1:9100"
        }
      }
    ]
  }
}
##### snipped #####
Default cephadm monitoring endpoints are meant for trusted networks unless secure monitoring is enabled. When mgr/cephadm/secure_monitoring_stack is true, use the HTTPS URLs and credentials configured for Prometheus and Alertmanager instead of the plain HTTP checks shown here.
- Check Alertmanager readiness.
$ curl --silent --head http://ceph-node1:9093/-/ready
HTTP/1.1 200 OK
Content-Type: text/plain; charset=utf-8
Date: Mon, 29 Jun 2026 08:34:18 GMT
- Check the Grafana login endpoint.
$ curl --insecure --silent --head https://ceph-node1:3000/login
HTTP/2 200
content-type: text/html; charset=UTF-8
cache-control: no-store
date: Mon, 29 Jun 2026 08:34:44 GMT
Use --insecure only when the current Grafana certificate is not trusted by the client. If dashboard users reach Grafana through a different DNS name, set the browser-facing URL with ceph dashboard set-grafana-frontend-api-url https://monitoring.example.net:3000.