The Ceph Dashboard gives storage administrators a browser view of cluster health, manager services, pools, OSD state, and storage features that are otherwise checked from the ceph CLI. Enabling it is useful after a cephadm bootstrap, manager redeploy, or hardened cluster build where command-line administration works but the web console is not ready for operators.
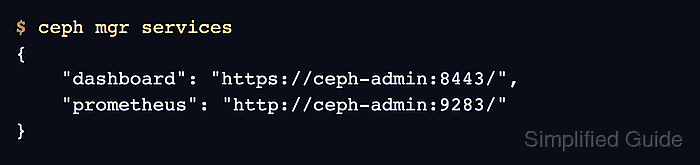
The dashboard runs as a ceph-mgr module on the active manager daemon. SSL is enabled by default, the usual HTTPS listener is port 8443, and ceph mgr services advertises the URL that a browser should use after the module is running.
Use a Ceph administrator shell on a host with cluster configuration and a privileged keyring, or run the same commands through cephadm shell when the host does not have local admin files. A self-signed certificate is enough for an isolated lab, but a production dashboard should use a CA-issued RSA certificate and a named administrator account whose password is not left in shell history.
Steps to enable the Ceph Dashboard:
- Open a shell that can run Ceph administrator commands.
$ ceph -s
  cluster:
    id:     11111111-2222-3333-4444-555555555555
    health: HEALTH_OK

  services:
    mon: 3 daemons, quorum ceph-node1,ceph-node2,ceph-node3 (age 2h)
    mgr: ceph-admin.a1b2c3(active, since 2h), standbys: ceph-node2
##### snipped #####
Use sudo cephadm shell -- ceph -s when the admin keyring is not installed on the current host.
Related: How to check Ceph cluster health - Enable the dashboard manager module.
$ ceph mgr module enable dashboard
No output means the manager accepted the module-enable request. If the module was already enabled, Ceph leaves it enabled.
- Confirm that the dashboard module is enabled.
$ ceph mgr module ls
MODULE
balancer                 on
crash                    on
dashboard                on
devicehealth             on
prometheus               on
restful                  off
##### snipped #####
- Create a self-signed dashboard certificate for first access.
$ ceph dashboard create-self-signed-cert
Self-signed certificate created
Browsers warn on this certificate because it is not signed by a trusted CA. For production access, install a CA-issued RSA certificate with ceph dashboard set-ssl-certificate and ceph dashboard set-ssl-certificate-key, then reload the manager module.
- Create a root-readable password file for the new dashboard administrator.
$ sudo install -m 600 /dev/null /root/dashboard-admin-password.txt
- Store a strong temporary password in the password file.
$ sudoedit /root/dashboard-admin-password.txt
Save exactly one password line. Avoid echo commands that place dashboard credentials in shell history.
- Create a named dashboard administrator account.
$ ceph dashboard ac-user-create storage-admin -i /root/dashboard-admin-password.txt administrator
The final argument assigns the built-in administrator role to the new user. Use a person-specific or team-specific account name instead of sharing the bootstrap admin login.
- Confirm that the account is enabled and has the administrator role.
$ ceph dashboard ac-user-show storage-admin { "username": "storage-admin", "roles": [ "administrator" ], "name": null, "email": null, "enabled": true, "pwdExpirationDate": null, "pwdUpdateRequired": false } - List the manager service URLs.
$ ceph mgr services
{
    "dashboard": "https://ceph-admin:8443/",
    "prometheus": "http://ceph-admin:9283/"
}
If the dashboard key is missing, check the active manager log and re-enable the module after certificate changes.
- Test the HTTPS listener from a host that can reach the active manager.
$ curl --insecure --head https://ceph-admin:8443/
HTTP/1.1 200 OK
Content-Type: text/html; charset=utf-8
Server: CherryPy/18.10.0
Date: Mon, 29 Jun 2026 08:20:31 GMT
Use --insecure only for the self-signed certificate check. Remove it after installing a CA-issued certificate that the client trusts.
- Open the dashboard URL in a browser and sign in as storage-admin.
https://ceph-admin:8443/
A successful sign-in opens the dashboard overview with cluster health, capacity, and service panels. A certificate warning is expected only while the self-signed certificate is in use.
- Remove the temporary password file after the login test succeeds.
$ sudo rm /root/dashboard-admin-password.txt

Mohd Shakir Zakaria is a cloud architect with deep roots in software development and open-source advocacy. Certified in AWS, Red Hat, VMware, ITIL, and Linux, he specializes in designing and managing robust cloud and on-premises infrastructures.


