Numeric prediction projects need a baseline that shows whether the available features carry signal before more flexible estimators enter the comparison. scikit-learn provides LinearRegression as an ordinary least squares estimator with the same fit() and predict() interface used across its regression models.
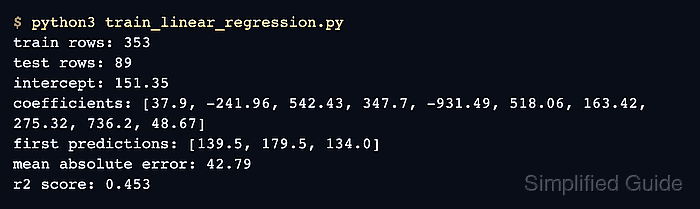
The built-in diabetes dataset supplies 442 rows and 10 numeric features, which keeps the training path reproducible without a local data file. A fixed 80/20 split leaves 353 training rows and 89 held-out rows, preventing the estimator from being evaluated on the rows it used during fitting.
Mean absolute error reports prediction error in the target's units, while R² compares the predictions with a constant mean baseline. LinearRegression does not regularize its coefficients, so the trained model provides a reference point for later Ridge, Lasso, or preprocessing-pipeline comparisons.
Steps to train a scikit-learn linear regression model:
- Save the dataset imports and loading section in train_linear_regression.py.
- train_linear_regression.py
from sklearn.datasets import load_diabetes
from sklearn.linear_model import LinearRegression
from sklearn.metrics import mean_absolute_error, r2_score
from sklearn.model_selection import train_test_split

X, y = load_diabetes(return_X_y=True)
- Append a reproducible 80/20 train/test split to train_linear_regression.py.
X_train, X_test, y_train, y_test = train_test_split(
    X,
    y,
    test_size=0.2,
    random_state=42,
)
random_state=42 fixes the shuffle so repeated runs use the same training and test rows.
- Append the estimator fitting and held-out prediction section to train_linear_regression.py.
model = LinearRegression()
model.fit(X_train, y_train)
predictions = model.predict(X_test)
- Append fitted-state and regression-metric output to train_linear_regression.py.
print(f"training rows: {X_train.shape[0]}")
print(f"test rows: {X_test.shape[0]}")
print(f"features fitted: {model.n_features_in_}")
print(f"first predictions: {predictions[:3].round(1).tolist()}")
print(f"mean absolute error: {mean_absolute_error(y_test, predictions):.2f}")
print(f"r2 score: {r2_score(y_test, predictions):.3f}")
- Compare the assembled train_linear_regression.py with the complete script.
- train_linear_regression.py
from sklearn.datasets import load_diabetes
from sklearn.linear_model import LinearRegression
from sklearn.metrics import mean_absolute_error, r2_score
from sklearn.model_selection import train_test_split

X, y = load_diabetes(return_X_y=True)

X_train, X_test, y_train, y_test = train_test_split(
    X,
    y,
    test_size=0.2,
    random_state=42,
)

model = LinearRegression()
model.fit(X_train, y_train)
predictions = model.predict(X_test)

print(f"training rows: {X_train.shape[0]}")
print(f"test rows: {X_test.shape[0]}")
print(f"features fitted: {model.n_features_in_}")
print(f"first predictions: {predictions[:3].round(1).tolist()}")
print(f"mean absolute error: {mean_absolute_error(y_test, predictions):.2f}")
print(f"r2 score: {r2_score(y_test, predictions):.3f}")
- Run the completed linear regression script.
$ python3 train_linear_regression.py
training rows: 353
test rows: 89
features fitted: 10
first predictions: [139.5, 179.5, 134.0]
mean absolute error: 42.79
r2 score: 0.453
The fitted-feature count and prediction list confirm that fit() and predict() completed on the 10-feature dataset. Mean absolute error approaches 0 as predictions improve; R² is 1 for perfect predictions, 0 for the constant mean baseline, and can fall below 0 for a worse model.

Mohd Shakir Zakaria is a cloud architect with deep roots in software development and open-source advocacy. Certified in AWS, Red Hat, VMware, ITIL, and Linux, he specializes in designing and managing robust cloud and on-premises infrastructures.


