A classifier can post a strong accuracy score while missing one label often enough to matter. A scikit-learn classification report separates performance by class so precision, recall, F1-score, and sample support can be reviewed together.
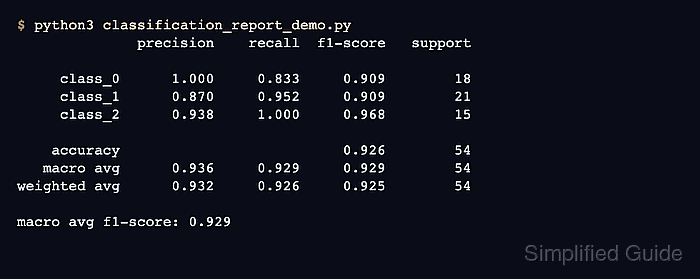
The classification_report() function compares true labels with predicted labels in matching sample order. Human-readable target_names make encoded classes easier to identify, but their order must match the numeric labels included in the report.
Macro averages give every class equal weight, while weighted averages account for the number of samples in each class. Reading both rows prevents a well-represented class from obscuring weak F1 performance on a smaller class.
Steps to create a scikit-learn classification report:
- Create classification_report_demo.py with held-out labels and predictions in matching sample order.
- classification_report_demo.py
from sklearn.metrics import classification_report

y_true = [0, 0, 1, 1, 1, 2, 2, 2]
y_pred = [0, 1, 1, 1, 2, 2, 2, 2]
In real-model use, both lists should contain labels from the same evaluation split.
Related: How to split data into train and test sets with scikit-learn - Append readable class names and the classification_report() call to classification_report_demo.py.
target_names = ["class_0", "class_1", "class_2"]

print(
    classification_report(
        y_true,
        y_pred,
        target_names=target_names,
        digits=3,
        zero_division=0,
    )
)
zero_division=0 assigns zero to an undefined metric without raising the default warning. Each class name occupies the same position as its numeric label.
- Run classification_report_demo.py to display its metric table.
$ python3 classification_report_demo.py
              precision    recall  f1-score   support

     class_0      1.000     0.500     0.667         2
     class_1      0.667     0.667     0.667         3
     class_2      0.750     1.000     0.857         3

    accuracy                          0.750         8
   macro avg      0.806     0.722     0.730         8
weighted avg      0.781     0.750     0.738         8
Each class row confirms its precision, recall, F1-score, and support. The support values total 8, matching the sample count on the aggregate rows.

Mohd Shakir Zakaria is a cloud architect with deep roots in software development and open-source advocacy. Certified in AWS, Red Hat, VMware, ITIL, and Linux, he specializes in designing and managing robust cloud and on-premises infrastructures.


