A Node.js memory leak shows up when a process keeps retaining objects after the same request, job, or test case has finished. The signal to trust is not a single high RSS value, but repeated growth in V8 heap use after the same workload runs more than once.
Node.js exposes process memory through process.memoryUsage(), and a running process can write V8 heap snapshots when it receives a configured signal. The memory sampler separates JavaScript heap growth from whole-process RSS growth, while the snapshots show which constructors, arrays, maps, closures, listeners, or cache entries retain the objects.
Heap snapshots stop the main thread while they are written and can require a large amount of extra memory. Capture them from a staging process, canary, or production instance that can restart without taking the service down, and keep the files out of public paths because request data and object values can appear inside the snapshot.
Steps to debug a Node.js memory leak:
- Add a temporary memory sampler beside the suspected operation.
import { memoryUsage } from 'node:process';

function toMiB(bytes) {
  return Math.round(bytes / 1024 / 1024);
}

export function logMemory(label) {
  const { heapUsed, rss, external, arrayBuffers } = memoryUsage();
  const fields = [
    `heapUsed=${toMiB(heapUsed)} MB`,
    `rss=${toMiB(rss)} MB`,
    `external=${toMiB(external)} MB`,
    `arrayBuffers=${toMiB(arrayBuffers)} MB`,
  ];

  console.log(`${label} ${fields.join(' ')}`);
}
heapUsed is the V8 JavaScript heap. rss is the whole process footprint, including JavaScript objects, native allocations, code, stacks, and allocator overhead.
- Run the suspected workload several times with the sampler enabled.
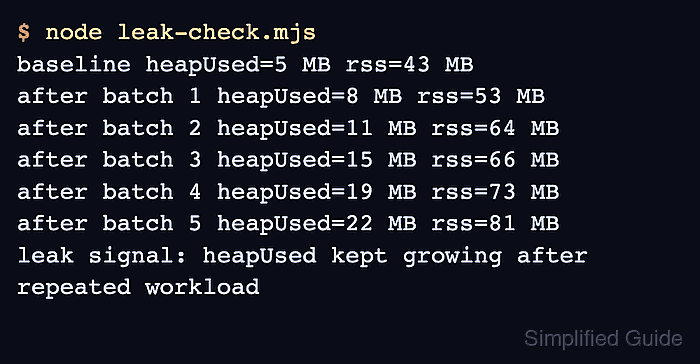
$ node leak-check.mjs
baseline heapUsed=5 MB rss=43 MB
after batch 1 heapUsed=8 MB rss=53 MB
after batch 2 heapUsed=11 MB rss=64 MB
after batch 3 heapUsed=15 MB rss=66 MB
after batch 4 heapUsed=19 MB rss=73 MB
after batch 5 heapUsed=22 MB rss=81 MB
leak signal: heapUsed kept growing after repeated workload
Replace leak-check.mjs with the request replay, worker job, queue consumer, or local test harness that reproduces the memory growth. If rss rises while heapUsed stays flat, inspect Buffer or ArrayBuffer use, native modules, image or compression libraries, and allocator fragmentation before treating the symptom as a JavaScript object leak.
- Start the affected process with heap snapshots enabled.
$ node --heapsnapshot-signal=SIGUSR2 snapshot-target.mjs
batch 1 pid=4242 heapUsed=7 MB rss=55 MB
batch 2 pid=4242 heapUsed=10 MB rss=60 MB
##### snipped #####
Use your real app entry point or process manager command in place of snapshot-target.mjs. Keep the snapshot run on a controlled process, because writing a large snapshot can pause or crash the instance.
- Capture the first heap snapshot after warm-up from another terminal.
$ kill -USR2 4242
The process ID is the Node.js process started with --heapsnapshot-signal=SIGUSR2. The process continues running after writing the snapshot unless it runs out of memory while the file is being created.
- Capture a second heap snapshot after the repeated workload grows the heap again.
$ kill -USR2 4242
Keep the workload between the two snapshots as narrow as possible. Extra requests, unrelated jobs, or admin probes add noise to the comparison.
- List the heap snapshot files.
$ ls Heap.*.heapsnapshot
Heap.20260628.001143.4242.0.001.heapsnapshot
Heap.20260628.001144.4242.0.002.heapsnapshot
- Compare the two heap snapshots in Chrome DevTools.
Open DevTools → Memory, load the older snapshot first, load the newer snapshot second, select the newer snapshot, and switch the view from Summary to Comparison. Investigate large positive retained-size deltas and the retaining path that keeps those objects reachable.
- Fix the retaining owner and rerun the sampler.
$ node --expose-gc leak-check.mjs
baseline heapUsed=4 MB rss=46 MB
after batch 1 heapUsed=4 MB rss=58 MB
after batch 2 heapUsed=4 MB rss=62 MB
after batch 3 heapUsed=4 MB rss=62 MB
after batch 4 heapUsed=4 MB rss=63 MB
after batch 5 heapUsed=4 MB rss=63 MB
retest signal: heapUsed stopped growing after warm-up
Common retaining owners are unbounded arrays, maps keyed by request data, process-wide caches without eviction, event listeners added per request, timers that capture request objects, and unresolved promises. Use --expose-gc only in a local reproduction when the sampler explicitly calls globalThis.gc?.() before printing; do not add it to production startup.
- Remove the temporary sampler, diagnostic startup flag, and snapshot files after the retest.
$ rm Heap.*.heapsnapshot
Heap snapshots can contain request bodies, headers, tokens, usernames, and object values. Move required evidence into a restricted incident folder before deleting the working copies.

Mohd Shakir Zakaria is a cloud architect with deep roots in software development and open-source advocacy. Certified in AWS, Red Hat, VMware, ITIL, and Linux, he specializes in designing and managing robust cloud and on-premises infrastructures.


