System incidents often leave evidence in the systemd journal before they appear in application dashboards or status pages. Reading that journal with journalctl lets an operator inspect service starts, kernel messages, authentication events, and error bursts from one place instead of chasing several log files first.
The journal is structured storage managed by systemd-journald. journalctl prints accessible entries in timestamp order by default, and its built-in filters can narrow output by recent line count, boot, service unit, severity, or time window before the log stream reaches the terminal.
Full system logs usually require sudo or membership in a journal-reading group such as systemd-journal, adm, or wheel. Older boot history also depends on journal retention and whether persistent storage exists under /var/log/journal, so a missing older entry may mean the host did not retain it rather than that the event never happened.
Steps to view system logs with journalctl:
- Show the newest journal entries without opening the pager.
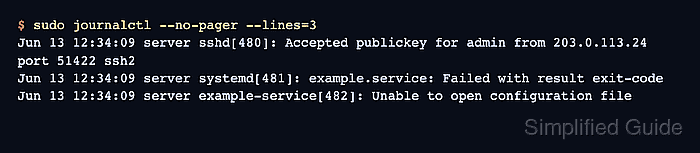
$ sudo journalctl --no-pager --lines=3
Jun 13 12:34:09 server sshd[480]: Accepted publickey for admin from 203.0.113.24 port 51422 ssh2
Jun 13 12:34:09 server systemd[481]: example.service: Failed with result exit-code
Jun 13 12:34:09 server example-service[482]: Unable to open configuration file
Omit --no-pager for interactive reading in less. Use --lines=20 or another value when the first view needs more context.
- Limit the view to messages from the current boot.
$ sudo journalctl --boot --no-pager --lines=3
Jun 13 12:34:09 server sshd[480]: Accepted publickey for admin from 203.0.113.24 port 51422 ssh2
Jun 13 12:34:09 server systemd[481]: example.service: Failed with result exit-code
Jun 13 12:34:09 server example-service[482]: Unable to open configuration file
Use --boot=-1 for the previous boot when retained journal files include it.
- Narrow the journal to the incident window.
$ sudo journalctl --since "5 minutes ago" --until "now" --no-pager --lines=3
Jun 13 12:34:09 server sshd[480]: Accepted publickey for admin from 203.0.113.24 port 51422 ssh2
Jun 13 12:34:09 server systemd[481]: example.service: Failed with result exit-code
Jun 13 12:34:09 server example-service[482]: Unable to open configuration file
--since and --until accept absolute timestamps such as 2026-06-13 12:30:00 and relative values such as 1 hour ago.
- Filter the journal to one systemd service unit when a specific daemon is involved.
$ sudo journalctl --unit=ssh.service --no-pager --lines=20
Jun 13 12:31:42 server sshd[391]: Server listening on 0.0.0.0 port 22.
Jun 13 12:31:42 server sshd[391]: Server listening on :: port 22.
Jun 13 12:31:42 server systemd[1]: Started ssh.service - OpenBSD Secure Shell server.
Replace ssh.service with the unit name from systemctl.
Related: How to view Linux service logs with journalctl - Show only error-level and more severe messages.
$ sudo journalctl --priority=err --no-pager --lines=3
Jun 13 12:33:35 server example-service[445]: Unable to open configuration file
Jun 13 12:33:57 server example-service[464]: Unable to open configuration file
Jun 13 12:34:09 server example-service[482]: Unable to open configuration file
Single priority values include matching messages at that level and more severe levels. Use a range such as --priority=warning..alert when the review needs only those levels.
- Follow new journal entries while reproducing the issue.
$ sudo journalctl --follow
Jun 13 12:35:10 server example-service[503]: Reload requested
Jun 13 12:35:11 server example-service[503]: Unable to open configuration file
Press Ctrl+C to stop following and return to the shell prompt.
- Save a focused log slice when the output must be reviewed or shared.
$ sudo journalctl --boot --since "5 minutes ago" --until "now" --output=short-iso > journal-slice.log
Journal output can include usernames, IP addresses, hostnames, paths, and command lines. Review and sanitize journal-slice.log before attaching it to a ticket or pasting it into another tool.
Tool: Application Log Pattern Analyzer - Check how much disk space the journal is using.
$ sudo journalctl --disk-usage
Archived and active journals take up 8M in the file system.
Use the dedicated journal size check before changing retention or cleanup settings.
Related: How to check systemd journal size in Linux

Mohd Shakir Zakaria is a cloud architect with deep roots in software development and open-source advocacy. Certified in AWS, Red Hat, VMware, ITIL, and Linux, he specializes in designing and managing robust cloud and on-premises infrastructures.


