Architecture diagrams make a Keras model easier to review when layer order, shape changes, or branching connections matter. A plotted PNG lets another reader inspect the graph before training, export, or code review without opening the model-building code.
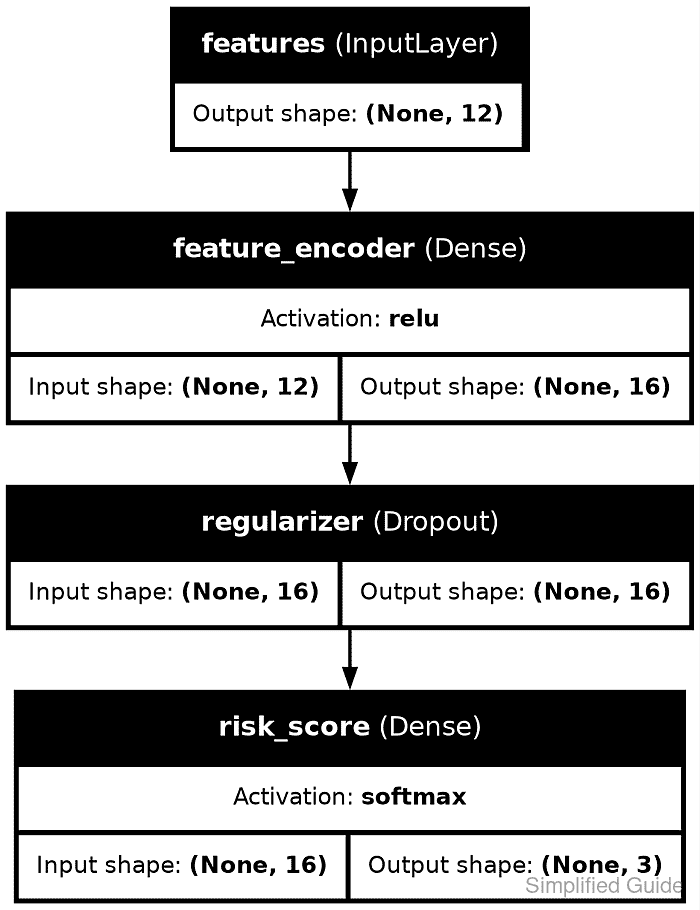
keras.utils.plot_model() passes the model graph to pydot and Graphviz, then writes the rendered image to the path in to_file. Shape labels, layer names, and activations are optional display fields, so enable them explicitly when the diagram is meant for inspection.
Standalone Keras must know its backend before the first import keras statement. The Python file uses JAX and a small Functional model for a repeatable check, but the same plotting call works with a project model after its backend and plotting dependencies are installed.
Related: How to show model summary in Keras
Related: How to create a functional model in Keras
Steps to plot a Keras model diagram:
- Refresh the Ubuntu package metadata.
$ sudo apt update
- Install Graphviz for the dot renderer.
$ sudo apt install --assume-yes graphviz
- Install pydot in the active Python environment.
$ python -m pip install pydot
pydot is the Python bridge used by Keras, while Graphviz supplies the renderer that writes the image.
Related: How to install Keras with pip - Create plot_model_diagram.py with backend selection, a small model, and a plotting call.
- plot_model_diagram.py
import os
import struct
from pathlib import Path

os.environ["KERAS_BACKEND"] = "jax"

import keras
from keras import layers


inputs = keras.Input(shape=(12,), name="features")
x = layers.Dense(16, activation="relu", name="feature_encoder")(inputs)
x = layers.Dropout(0.2, name="regularizer")(x)
outputs = layers.Dense(3, activation="softmax", name="risk_score")(x)
model = keras.Model(inputs=inputs, outputs=outputs, name="risk_score_model")

output_path = Path("model-plot.png")
keras.utils.plot_model(
    model,
    to_file=output_path,
    show_shapes=True,
    show_layer_names=True,
    show_layer_activations=True,
    rankdir="TB",
    dpi=160,
)

png_bytes = output_path.read_bytes()
width, height = struct.unpack(">II", png_bytes[16:24])

print(f"backend: {keras.backend.backend()}")
print("layers:", ", ".join(layer.name for layer in model.layers))
print(f"plot file: {output_path}")
print(f"image size: {width}x{height}")
print(f"file bytes: {output_path.stat().st_size}")
Set KERAS_BACKEND before importing keras. Use the backend already installed for the project when it is not JAX.
Related: How to set the Keras backend - Run the script and confirm that Keras writes the plot file.
$ python plot_model_diagram.py
backend: jax
layers: features, feature_encoder, regularizer, risk_score
plot file: model-plot.png
image size: 939x1221
file bytes: 102682
- Open model-plot.png and confirm that the diagram shows the expected layer names, activations, and output shapes.
The generated image should show features → feature_encoder → regularizer → risk_score, ending with output shape (None, 3).

Mohd Shakir Zakaria is a cloud architect with deep roots in software development and open-source advocacy. Certified in AWS, Red Hat, VMware, ITIL, and Linux, he specializes in designing and managing robust cloud and on-premises infrastructures.


