How to profile TensorFlow training in TensorBoard
A training loop can spend more time feeding data or dispatching host work than executing model operations. TensorFlow Profiler records the short runtime window that TensorBoard needs to separate input, host, and device activity.
The function API places an explicit boundary around five measured steps. Three warm-up batches run before capture so graph tracing and optimizer initialization do not dominate the profile.
Installing TensorBoard and its Profile plugin in the active TensorFlow environment is a convenient way to keep the selected packages together. TensorBoard can also read a compatible profile log from another environment; the decisive check is whether the Profile view opens the captured session and renders its trace.
Steps to profile TensorFlow training in TensorBoard:
- Install TensorBoard plus its Profile plugin in the active TensorFlow environment.
$ python3 -m pip install --upgrade tensorboard tensorboard-plugin-profile
This single-environment path keeps the profiler packages together, but TensorBoard may instead run from another environment that can read the compatible log directory.
Related: How to create a virtual environment for TensorFlow
Related: How to install TensorFlow with pip - Create profile-training.py with the log directory and deterministic input pipeline.
- profile-training.py
from pathlib import Path
import shutil

import tensorflow as tf


log_dir = Path("logs/profile-training")
if log_dir.exists():
    shutil.rmtree(log_dir)

features = tf.random.stateless_uniform((512, 32), seed=(7, 11))
labels = tf.cast(tf.reduce_sum(features, axis=1, keepdims=True) > 16.0, tf.float32)
dataset = tf.data.Dataset.from_tensor_slices((features, labels))
dataset = dataset.batch(32).repeat().prefetch(tf.data.AUTOTUNE)
The script removes only its own logs/profile-training directory so an earlier trace cannot hide a failed capture.
- Append the model state to profile-training.py.
iterator = iter(dataset)

model = tf.keras.Sequential(
    [
        tf.keras.layers.Input(shape=(32,)),
        tf.keras.layers.Dense(16, activation="relu"),
        tf.keras.layers.Dense(1, activation="sigmoid"),
    ]
)
optimizer = tf.keras.optimizers.Adam()
loss_fn = tf.keras.losses.BinaryCrossentropy()
- Append the compiled training step plus its warm-up loop to profile-training.py.
@tf.function
def train_step(batch_features, batch_labels):
    with tf.GradientTape() as tape:
        predictions = model(batch_features, training=True)
        loss = loss_fn(batch_labels, predictions)
    gradients = tape.gradient(loss, model.trainable_variables)
    optimizer.apply_gradients(zip(gradients, model.trainable_variables))
    return loss


for _ in range(3):
    train_step(*next(iterator))
The warm-up iterations create the compiled graph and optimizer variables before profiling begins.
- Append the five-step profiler capture block to profile-training.py.
tf.profiler.experimental.start(str(log_dir))
try:
    for step in range(5):
        with tf.profiler.experimental.Trace("train", step_num=step, _r=1):
            batch = next(iterator)
            loss = train_step(*batch)
finally:
    tf.profiler.experimental.stop()

trace_files = sorted(log_dir.glob("plugins/profile/**/*.xplane.pb"))
if not trace_files:
    raise RuntimeError("TensorFlow did not write an xplane profile trace")

trace_file = trace_files[0]
print("profile_steps=5")
print(f"profile_trace={trace_file}")
print(f"profile_bytes={trace_file.stat().st_size}")
Dataset iteration remains inside tf.profiler.experimental.Trace so the Profile dashboard can attribute input-pipeline time to each measured step. TensorFlow recommends profiling no more than ten steps and skipping initialization batches.
Related: How to run a custom training loop in TensorFlow - Run profile-training.py to write a nonempty TensorFlow profiler trace.
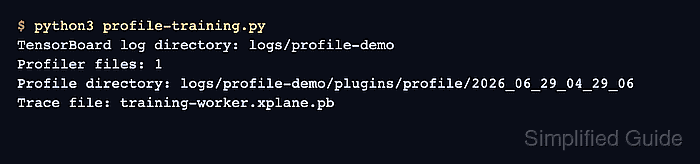
$ python3 profile-training.py
profile_steps=5
profile_trace=logs/profile-training/plugins/profile/2026_07_18_13_02_46/training-host.xplane.pb
profile_bytes=60481
The timestamp, trace filename, and byte count vary between runs. A missing trace raises an error instead of printing a success result.
- Start TensorBoard from the profile log directory on the loopback interface.
$ tensorboard --logdir logs/profile-training --host 127.0.0.1 --port 6006
TensorBoard 2.21.0 at http://127.0.0.1:6006/ (Press CTRL+C to quit)
The --host 127.0.0.1 setting limits the dashboard to local analysis. Binding TensorBoard to 0.0.0.0 exposes the dashboard to other hosts that can reach the machine.
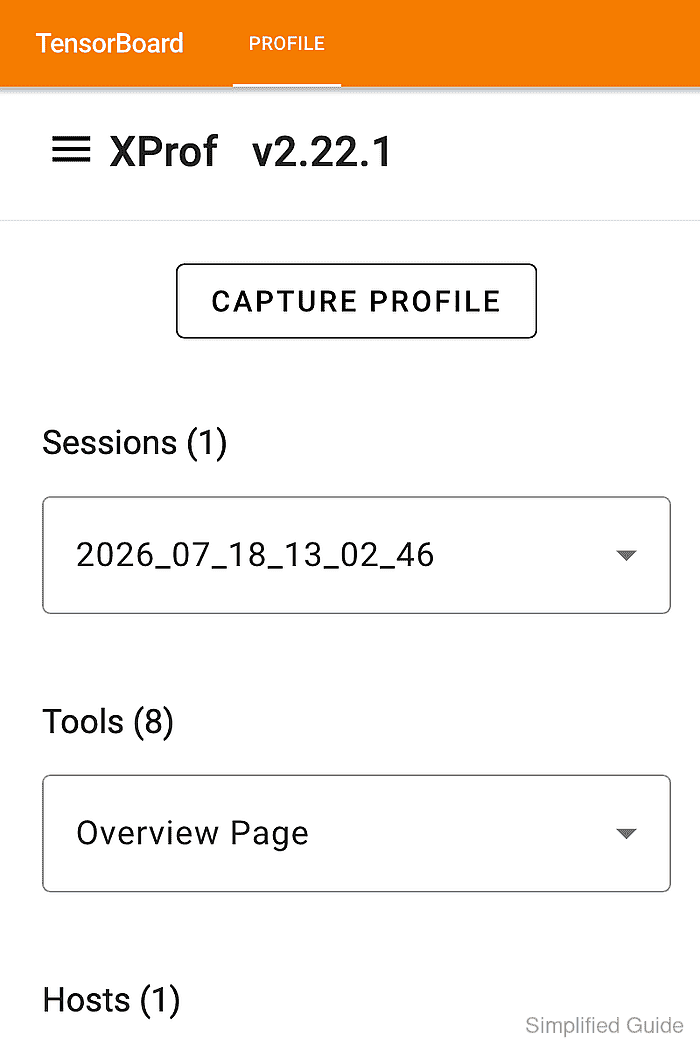
- Open http://127.0.0.1:6006/#profile in a browser to load the captured session.
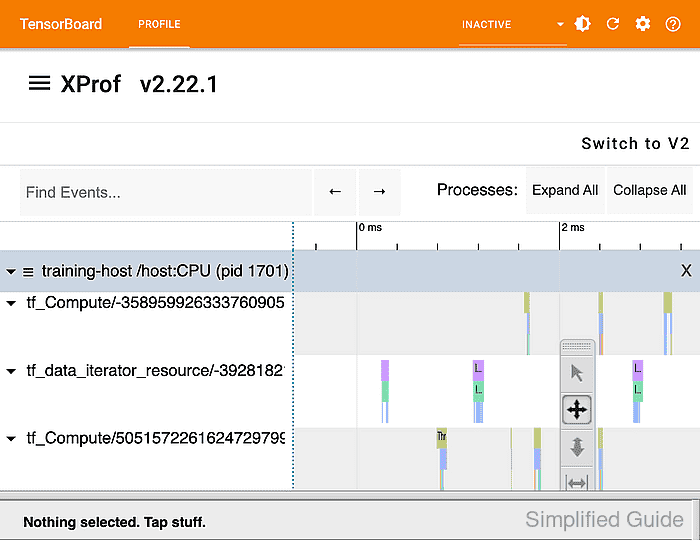
- Select Trace Viewer from Tools to render the captured five-step timeline.