How to inspect variables with the Jupyter Notebook debugger
Notebook 7 includes a browser debugger for pausing Python notebook execution and reading values from the active stack frame. This helps when a cell returns the wrong result and the value that caused it exists only briefly inside a function or loop.
The debugger button is available when the selected kernel supports the Jupyter Debug Protocol. A normal Python 3 (ipykernel) notebook can use breakpoints, stepping controls, the call stack, and the variable viewer without opening the notebook in a separate desktop editor.
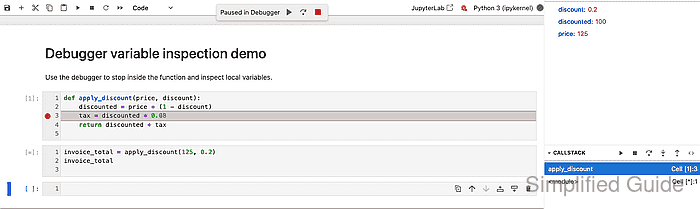
A breakpoint pauses before the highlighted line runs. Values assigned earlier in the same frame appear under Variables, while a value assigned on the highlighted line appears only after stepping over that line.
Steps to inspect variables with the Jupyter Notebook debugger:
- Open a notebook with Python 3 (ipykernel) and prepare code with a value worth checking.
def apply_discount(price, discount):
    discounted = price * (1 - discount)
    tax = discounted * 0.08
    return discounted + tax
invoice_total = apply_discount(125, 0.2) invoice_total
Put the function definition in one cell and the function call in the next cell. Existing notebook code works the same way when the target function or cell is already present.
- Click the bug icon in the upper-right toolbar to enable the debugger.
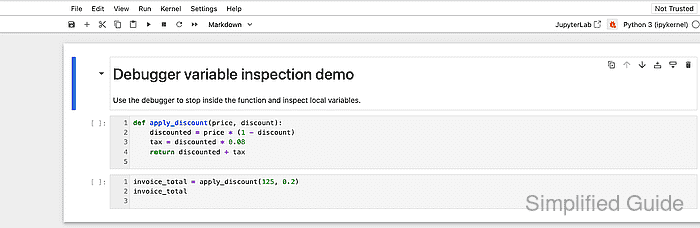
The toolbar button changes from Enable Debugger to Disable Debugger after the debugger starts.
- Run the function definition cell once so the function exists in the kernel session.
- Click the breakpoint gutter beside the line to inspect.

The red marker in the gutter shows the breakpoint. Line 3 pauses execution before tax = discounted * 0.08 runs.
- Run the cell that calls the function.
- Open View → Debugger Panel if the Variables section is not visible.
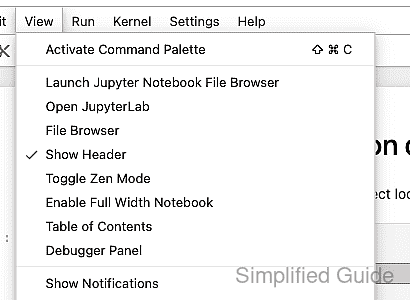
- Confirm the local values under Variables while execution is paused.
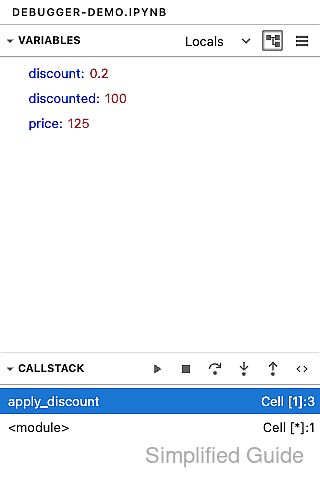
The paused frame shows discounted as 100, price as 125, and discount as 0.2. Click Continue after recording the value, or click the stop control to abandon the paused run.