How to use Grafana query inspector
Grafana query inspector shows the returned data, request timing, raw query request, response payload, and JSON behind a dashboard panel. Operators use it when a panel looks wrong, runs slowly, or needs evidence for the exact request Grafana sent to the data source.

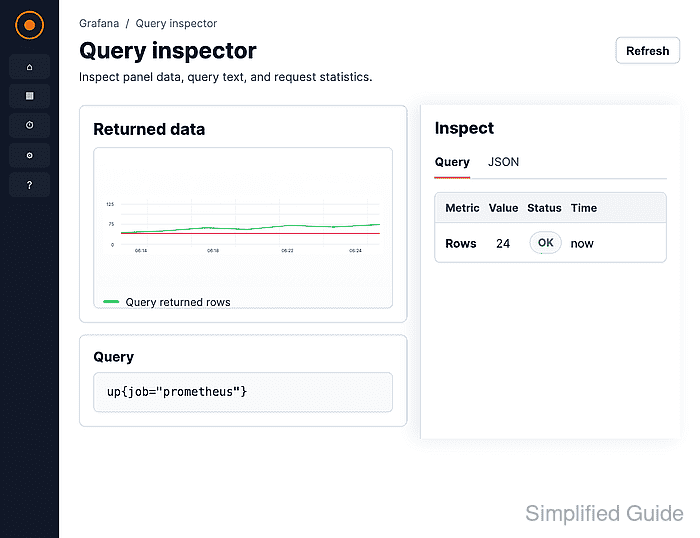
Inspect opens from the panel menu and keeps the evidence tied to the selected panel, dashboard time range, and variable state. The Data and Stats tabs show returned rows and request timing, while Query refreshes the data source request so the raw request and response can be copied.
The inspector does not save dashboard changes. Use a panel that already runs or reproduces the problem, keep the same time range while gathering evidence, and remove sensitive query values before sharing copied request or JSON output.
Steps to use Grafana query inspector:
- Open the Grafana dashboard that contains the panel to inspect.

Keep the dashboard time range and variable values unchanged while gathering the first inspector evidence.
- Hover over the panel title and open the panel menu.
- Hover over Inspect and select Data.

Data opens the inspector drawer for the selected panel. The same drawer includes Stats, Query, Meta data, and JSON tabs when the panel type and result support them.
- Review the Data tab for returned rows and formatted values.

Toggle Formatted data when the displayed panel values are needed instead of the raw returned values. Use Download CSV only when the exported rows do not expose sensitive series names, labels, or values.
- Open the Stats tab and check request timing, query count, and row count.

Total number rows confirms how much data the panel received. A slow Total request time or unexpectedly low row count points the next check toward the query, data source, or time range.
- Open the Query tab.
Grafana prompts for a refresh before collecting raw request and response data for the inspected panel.
- Click the inspector Refresh button.

Refresh sends a fresh data source request for the inspected panel and populates the raw request and response. Use Copy to clipboard only after masking credentials, tenant IDs, internal hostnames, or other sensitive values.
- Expand the request and response objects on the Query tab when the panel result needs backend proof.
Check the data source type, request URL, query payload, time range fields, and response object before changing the panel query.
- Open the JSON tab and select the JSON source that matches the evidence to collect.
Panel Spec shows the panel definition, including data source and query settings. Other sources can expose panel data or data frame structures when available.
- Confirm that the inspector evidence matches the panel state being investigated.
A complete capture includes a Data table, a Stats row count and timing, and a Query request and response from the same panel and dashboard time range.