How to install Kibana on Ubuntu or Debian
Installing Kibana on Ubuntu or Debian adds Elastic's browser interface to a self-managed Elasticsearch deployment. The Debian package is the supported APT path for hosts that should receive Elastic Stack updates through the system package manager.
Elastic's 9.x repository supplies the current Kibana packages for Debian-based systems. The package installs the application, creates the default configuration and data directories, and registers the kibana.service systemd unit for service management.
Kibana needs a compatible Elasticsearch cluster before browser setup can finish. First enrollment uses a Kibana enrollment token from an Elasticsearch node, and package-based Elasticsearch installs that run under systemd may also require resetting the elastic password before the first sign-in.
Steps to install Kibana on Ubuntu or Debian:
- Refresh the package index on the target host.
$ sudo apt-get update
- Install the helper packages needed for Elastic's signed APT repository.
$ sudo apt-get install --assume-yes wget gpg ca-certificates apt-transport-https
apt-transport-https is already covered by current Ubuntu APT packages, but Elastic still lists it for Debian systems where HTTPS transport might not be present.
- Import the Elastic package signing key into the dedicated APT keyring.
$ wget -qO - https://artifacts.elastic.co/GPG-KEY-elasticsearch | sudo gpg --dearmor --yes -o /usr/share/keyrings/elasticsearch-keyring.gpg
No output indicates the keyring file was written successfully.
- Save the official Elastic 9.x repository definition.
$ echo "deb [signed-by=/usr/share/keyrings/elasticsearch-keyring.gpg] https://artifacts.elastic.co/packages/9.x/apt stable main" | sudo tee /etc/apt/sources.list.d/elastic-9.x.list
deb [signed-by=/usr/share/keyrings/elasticsearch-keyring.gpg] https://artifacts.elastic.co/packages/9.x/apt stable main
Do not use add-apt-repository for this repository. Elastic does not publish a source package, so an added deb-src entry can break apt-get update with a missing main/source/Sources error.
- Refresh the package index after adding the Elastic repository.
$ sudo apt-get update
Get:1 https://artifacts.elastic.co/packages/9.x/apt stable InRelease [3249 B]
Get:2 https://artifacts.elastic.co/packages/9.x/apt stable/main arm64 Packages [54.9 kB]
##### snipped #####
Reading package lists... Done
The package architecture in the output reflects the host, such as amd64 or arm64.
- Install the Kibana package.
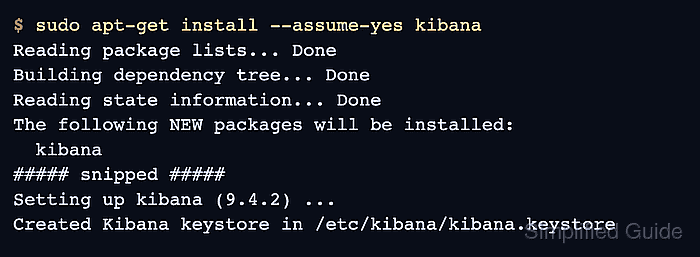
$ sudo apt-get install --assume-yes kibana
Reading package lists... Done
Building dependency tree... Done
Reading state information... Done
The following NEW packages will be installed:
  kibana
##### snipped #####
Setting up kibana (9.4.2) ...
Created Kibana keystore in /etc/kibana/kibana.keystore
The Debian package installs the application under /usr/share/kibana, keeps configuration under /etc/kibana, and writes persistent data under /var/lib/kibana. Keep Kibana on the same Elastic Stack version as the connected Elasticsearch cluster.
- Generate a fresh Kibana enrollment token on an Elasticsearch node.
$ sudo /usr/share/elasticsearch/bin/elasticsearch-create-enrollment-token -s kibana
eyJ2ZXIiOiI5LjQuMiIsImFkciI6WyJodHRwczovL2VzMDEuZXhhbXBsZS5uZXQ6OTIwMCJdLCJmZ3IiOiI##### snipped #####
The token is valid for about 30 minutes and writes the Elasticsearch URL, certificate trust, and service-account settings into /etc/kibana/kibana.yml during enrollment. Add --url with the cluster HTTPS endpoint when the token tool must reach a non-default Elasticsearch host.
Related: How to connect Kibana to Elasticsearch - Set server.host when browsers must reach Kibana from another host.
- /etc/kibana/kibana.yml
server.host: 0.0.0.0
Keep the default localhost binding for local-only access, or use a specific interface address when only one network should reach the UI.
Related: How to set the Kibana server hostBinding to 0.0.0.0 exposes port 5601 on every interface. Pair remote access with a firewall, reverse proxy, or another network control before allowing untrusted networks to reach Kibana.
- Reload the systemd manager configuration so the new unit file is visible.
$ sudo systemctl daemon-reload
- Enable Kibana at boot and start it now.
$ sudo systemctl enable --now kibana.service
Created symlink /etc/systemd/system/multi-user.target.wants/kibana.service -> /usr/lib/systemd/system/kibana.service.
The command may print only the symlink line when enablement changes; startup errors are reported through systemctl status or journalctl.
Related: How to manage the Kibana service with systemctl in Linux - Check the Kibana service status for the running state, setup URL, and verification code.
$ sudo systemctl status kibana.service --no-pager
● kibana.service - Kibana
     Loaded: loaded (/usr/lib/systemd/system/kibana.service; enabled; preset: enabled)
     Active: active (running) since Thu 2026-06-18 13:56:12 UTC; 18s ago
##### snipped #####
Jun 18 13:56:21 kibana-01 kibana[8123]: Kibana has not been configured.
Jun 18 13:56:21 kibana-01 kibana[8123]: Go to http://kibana.example.net:5601/?code=123456 to get started.
The first-start status output commonly shows the browser URL and a six-digit verification code while Kibana waits for enrollment.
Related: How to manage the Kibana service with systemctl in Linux - Open the setup URL from the status output and paste the current Kibana enrollment token.
http://kibana.example.net:5601/?code=123456
Click Configure Elastic after pasting the token, and enter the six-digit verification code from systemctl status if the browser asks for it.
- Sign in on the Welcome to Elastic page with the elastic user and the current password for that cluster.
If the current elastic password is unknown on a package-based Elasticsearch node, reset it on an Elasticsearch host before signing in.
Related: How to reset built-in user passwords in Elasticsearch - Confirm the Kibana home page loads after enrollment and sign-in complete.
The first page can be the home page, a solution overview, or a sample-data prompt, but the main Kibana navigation should be available.
Related: How to check Kibana status