How to enable Prometheus monitoring for Ceph
Ceph clusters expose health, daemon status, and performance counters through the active ceph-mgr daemon. Enabling the prometheus manager module gives an external Prometheus server a scrape endpoint, so cluster metrics can feed dashboards and alerts without requiring operators to log in to the admin shell.
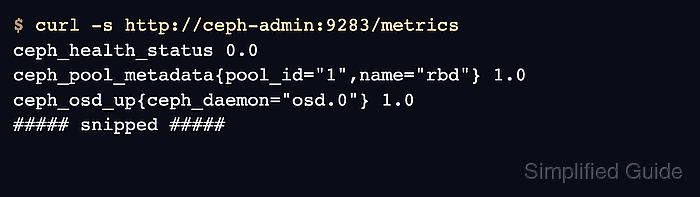
The module publishes metrics from manager hosts on port 9283 by default and advertises the active URL through ceph mgr services. The endpoint is separate from the full cephadm monitoring stack; it provides raw Ceph metrics for a Prometheus server that already exists or is managed outside the cluster.
Keep the Prometheus scrape interval aligned with the manager module interval. The Ceph module caches metrics between scrapes, and an external Prometheus job using the default 15s interval matches the module's default scrape cache timing without extra manager configuration.
Steps to enable Ceph Prometheus monitoring:
- Open a shell that can run Ceph administrator commands.
$ ceph -s
  cluster:
    id:     00000000-1111-2222-3333-444444444444
    health: HEALTH_OK

  services:
    mon: 3 daemons, quorum ceph-node1,ceph-node2,ceph-node3 (age 2h)
    mgr: ceph-node1.active (active, since 2h), standbys: ceph-node2, ceph-node3
##### snipped #####
Use cephadm shell -- ceph -s when the admin keyring is not installed on the current host.
Related: How to check Ceph cluster health
- Enable the prometheus manager module.
$ ceph mgr module enable prometheus
No output means the manager accepted the module-enable request. If the module was already enabled, Ceph leaves it enabled.
- Confirm that the prometheus module is enabled.
$ ceph mgr module ls
MODULE
balancer                 on
crash                    on
devicehealth             on
prometheus               on
restful                  off
##### snipped #####
- Check the manager service URLs.
$ ceph mgr services
{
    "dashboard": "https://ceph-admin:8443/",
    "prometheus": "http://ceph-admin:9283/"
}
If the prometheus URL is missing, check the active manager log and confirm the module is still listed as enabled.
- Request the Ceph metrics endpoint from a host that can reach the manager.
$ curl -s http://ceph-admin:9283/metrics
# HELP ceph_pool_metadata Pool metadata
# TYPE ceph_pool_metadata untyped
ceph_pool_metadata{pool_id="1",name="rbd"} 1.0
# HELP ceph_osd_metadata OSD metadata
# TYPE ceph_osd_metadata gauge
ceph_osd_metadata{ceph_daemon="osd.0",device_class="ssd",hostname="ceph-node1"} 1.0
##### snipped #####
Expose port 9283 only to trusted monitoring hosts or a private monitoring network. The endpoint can reveal pool names, daemon names, hostnames, and cluster capacity data.
- Add a Ceph scrape job to the Prometheus configuration.
- prometheus.yml
scrape_configs:
  - job_name: ceph
    honor_labels: true
    scrape_interval: 15s
    metrics_path: /metrics
    static_configs:
      - targets:
          - ceph-admin:9283
        labels:
          cluster: ceph-production
Use the active manager URL from ceph mgr services, a stable DNS name, or a load-balanced manager endpoint as the target. Keep the target in host:port form without http:// text.
Generate the final job with stable labels, intervals, and target grouping before changing Prometheus.
Tool: Prometheus Scrape Config Generator - Validate the complete Prometheus configuration.
$ promtool check config /etc/prometheus/prometheus.yml
Checking /etc/prometheus/prometheus.yml
 SUCCESS: /etc/prometheus/prometheus.yml is valid prometheus config file syntax
Run the check against the full Prometheus file after adding the Ceph job, not against the copied snippet alone.
- Reload Prometheus through the local service manager.
$ sudo systemctl reload prometheus
Use the reload, restart, container rollout, or operator-managed apply path that matches the way Prometheus is deployed.
- Confirm Prometheus is scraping the Ceph job.
$ promtool query instant http://prometheus.example.net:9090 'up{job="ceph"}'
up{cluster="ceph-production", instance="ceph-admin:9283", job="ceph"} => 1 @[1782662400.000]
A value of 1 means Prometheus reached the Ceph endpoint during the last scrape. A missing series or 0 means the scrape job loaded but the target is absent or failing.