How to check Ceph cluster health
A Ceph cluster can keep serving some workloads while a monitor, OSD, placement group, or managed daemon is already warning. The ceph status views expose those signals before maintenance, capacity work, or incident triage changes cluster state.
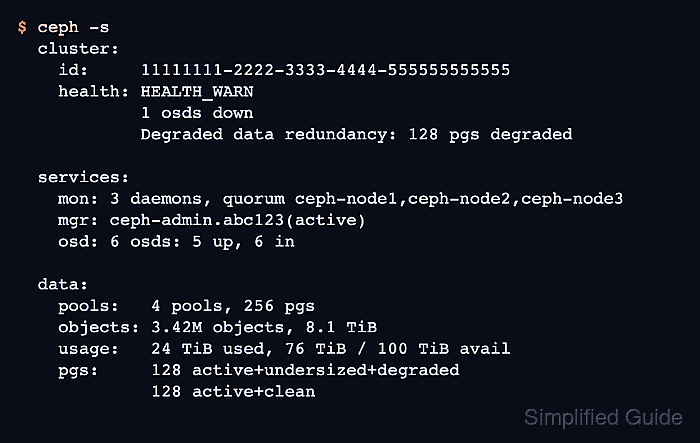
Start from an administration host that has the cluster configuration and a keyring for a user allowed to read status. The summary view shows monitor quorum, manager activity, OSD membership, data usage, and placement group state in one screen.
Use the detailed health and daemon checks to turn HEALTH_WARN or HEALTH_ERR into a named component. Record the health-check codes, affected daemon names, and placement group states before restarting services or changing storage devices so follow-up work targets the component Ceph reported.
Steps to check Ceph cluster health:
- Check the cluster status summary.
$ ceph -s
  cluster:
    id:     11111111-2222-3333-4444-555555555555
    health: HEALTH_WARN
            1 osds down
            Degraded data redundancy: 128 pgs degraded

  services:
    mon: 3 daemons, quorum ceph-node1,ceph-node2,ceph-node3 (age 2h)
    mgr: ceph-admin.abc123(active, since 2h)
    osd: 6 osds: 5 up, 6 in

  data:
    pools:   4 pools, 256 pgs
    objects: 3.42M objects, 8.1 TiB
    usage:   24 TiB used, 76 TiB / 100 TiB avail
    pgs:     128 active+undersized+degraded
             128 active+clean
ceph status returns the same summary. A clean cluster reports HEALTH_OK and placement groups such as active+clean.
- Read the detailed health checks when the summary is not HEALTH_OK.
$ ceph health detail
HEALTH_WARN 1 osds down; Degraded data redundancy: 128 pgs degraded
[WRN] OSD_DOWN: 1 osds down
    osd.12 (root=default,host=ceph-node2) is down
[WRN] PG_DEGRADED: Degraded data redundancy: 128 pgs degraded
    pg 1.2f is active+undersized+degraded, acting [4,12]
##### snipped #####
Record the bracketed check codes such as OSD_DOWN and PG_DEGRADED. They identify the follow-up area more precisely than the summary sentence.
- Refresh the cephadm daemon status.
$ ceph orch ps --refresh
NAME                    HOST        PORTS        STATUS         REFRESHED  AGE   MEM USE  MEM LIM  VERSION  IMAGE ID      CONTAINER ID
mon.ceph-node1          ceph-node1  *:6789,3300  running        5s ago     14d     94.2M        -  20.2.0   1a2b3c4d5e6f  aa11bb22cc33
mon.ceph-node2          ceph-node2  *:6789,3300  running        5s ago     14d     93.8M        -  20.2.0   1a2b3c4d5e6f  bb22cc33dd44
mgr.ceph-admin.abc123   ceph-admin  *:9283       running        5s ago     14d    512.0M        -  20.2.0   1a2b3c4d5e6f  cc33dd44ee55
osd.4                   ceph-node1               running        5s ago     30d      2.1G        -  20.2.0   1a2b3c4d5e6f  dd44ee55ff66
osd.12                  ceph-node2               stopped        5s ago     30d     18.2M        -  20.2.0   1a2b3c4d5e6f  ee55ff66aa77
osd.13                  ceph-node2               running        5s ago     30d      2.0G        -  20.2.0   1a2b3c4d5e6f  ff66aa77bb88
REFRESHED shows how recent the cached daemon state is. The --refresh option asks cephadm to update the table before printing it.
Related: How to manage Ceph services with cephadm - Map affected OSD IDs to their hosts.
$ ceph osd tree
ID  CLASS  WEIGHT    TYPE NAME             STATUS  REWEIGHT  PRI-AFF
-1         36.00000  root default
-3         12.00000      host ceph-node1
 4    hdd   6.00000          osd.4             up   1.00000  1.00000
 5    hdd   6.00000          osd.5             up   1.00000  1.00000
-5         12.00000      host ceph-node2
12    hdd   6.00000          osd.12          down   1.00000  1.00000
13    hdd   6.00000          osd.13            up   1.00000  1.00000
-7         12.00000      host ceph-node3
20    hdd   6.00000          osd.20            up   1.00000  1.00000
21    hdd   6.00000          osd.21            up   1.00000  1.00000
Stop at identification if the output points to a failed host or disk. Move to the matching OSD or host repair path instead of restarting unrelated daemons.
Related: How to replace a failed Ceph OSD - Check placement group state.
$ ceph pg stat
256 pgs: 128 active+undersized+degraded, 128 active+clean; 8.1 TiB data, 24 TiB used, 76 TiB / 100 TiB avail
Healthy placement groups normally settle at active+clean. Investigate stuck, inactive, unclean, undersized, degraded, or peering states before treating the cluster as ready for normal maintenance.
Related: How to troubleshoot stuck placement groups in Ceph - Check recent cluster health log entries when the state changed during inspection.
$ ceph log last 10
2026-06-29T08:12:40.123+0000 mon.ceph-node1 [WRN] Health check failed: 1 osds down (OSD_DOWN)
2026-06-29T08:12:43.019+0000 mon.ceph-node1 [WRN] Health check failed: Degraded data redundancy: 128 pgs degraded (PG_DEGRADED)
2026-06-29T08:19:14.530+0000 mon.ceph-node1 [INF] osd.12 marked up
2026-06-29T08:24:51.667+0000 mon.ceph-node1 [INF] Health check cleared: OSD_DOWN
2026-06-29T08:31:33.902+0000 mon.ceph-node1 [INF] Health check cleared: PG_DEGRADED
2026-06-29T08:31:33.903+0000 mon.ceph-node1 [INF] Cluster is now healthy
The cluster log helps distinguish a fresh failure from a warning that has already cleared or is still recovering.
- Confirm the clean state after the reported issue is resolved.
$ ceph health detail
HEALTH_OK
If the output still reports HEALTH_WARN or HEALTH_ERR, keep the named check code open and follow the matching repair guide before starting maintenance.